Collecting Logs
Yatai supports using Loki to collect, store and query BentoDeployment’s logs
Note
This documentation is just for BentoDeployment logs, not for Yatai itself.
Prerequisites
yatai-deployment
Because the metrics collected are related to BentotDeployment, it relies on yatai-deployment
Kubernetes
Kubernetes cluster with version 1.20 or newer
Note
If you do not have a production Kubernetes cluster and want to install yatai for development and testing purposes. You can use minikube to set up a local Kubernetes cluster for testing.
Dynamic Volume Provisioning
As Loki requires log storage, you need to enable dynamic volume provisioning in your Kubernetes cluster. For more detailed information, please refer to Dynamic Volume Provisioning.
Helm
We use Helm to install Loki Stack.
Quick setup
Note
This quick setup script can only be used for “”development”” and “”testing”” purposes
This script will automatically install the following dependencies inside the yatai-monitoring namespace of the Kubernetes cluster:
MinIO
Promtail
Loki
bash <(curl -s "https://raw.githubusercontent.com/bentoml/yatai/main/scripts/quick-setup-yatai-logging.sh")
Setup steps
1. Create a namespace for Logging Stack
kubectl create ns yatai-logging
2. Install MinIO
1. Create MinIO Tenant
Create a MinIO Tenant
export S3_ACCESS_KEY=$(LC_ALL=C tr -dc 'A-Za-z0-9' < /dev/urandom | head -c 20)
export S3_SECRET_KEY=$(LC_ALL=C tr -dc 'A-Za-z0-9' < /dev/urandom | head -c 20)

kubectl create secret generic yatai-logging-minio \
  --from-literal=accesskey=$S3_ACCESS_KEY \
  --from-literal=secretkey=$S3_SECRET_KEY \
  -n yatai-logging

cat <<EOF | kubectl apply -f -
apiVersion: minio.min.io/v2
kind: Tenant
metadata:
  labels:
    app: minio
  name: yatai-logging-minio
  namespace: yatai-logging
spec:
  credsSecret:
    name: yatai-logging-minio
  image: quay.io/bentoml/minio-minio:RELEASE.2021-10-06T23-36-31Z
  imagePullPolicy: IfNotPresent
  mountPath: /export
  podManagementPolicy: Parallel
  pools:
  - servers: 4
    volumeClaimTemplate:
      metadata:
        name: data
      spec:
        accessModes:
        - ReadWriteOnce
        resources:
          requests:
            storage: 20Gi
    volumesPerServer: 4
  requestAutoCert: false
  s3:
    bucketDNS: false
  subPath: /data
EOF
Install the
minio-operatorhelm chart
helm repo add minio https://operator.min.io/
helm repo update minio

export S3_ACCESS_KEY=$(LC_ALL=C tr -dc 'A-Za-z0-9' < /dev/urandom | head -c 20)
export S3_SECRET_KEY=$(LC_ALL=C tr -dc 'A-Za-z0-9' < /dev/urandom | head -c 20)

cat <<EOF > /tmp/minio-values.yaml
tenants:
- image:
    pullPolicy: IfNotPresent
    repository: quay.io/bentoml/minio-minio
    tag: RELEASE.2021-10-06T23-36-31Z
  metrics:
    enabled: false
    port: 9000
  mountPath: /export
  name: logging-minio
  namespace: yatai-logging
  pools:
  - servers: 4
    size: 20Gi
    volumesPerServer: 4
  secrets:
    accessKey: $S3_ACCESS_KEY
    enabled: true
    name: yatai-logging-minio
    secretKey: $S3_SECRET_KEY
  subPath: /data
EOF

helm install minio-operator minio/minio-operator -n yatai-logging -f /tmp/minio-values.yaml
Verify the
minio-operatorinstallation
Monitor the minio-operator components until all of the components show a STATUS of Running or Completed. You can do this by running the following command and inspecting the output:
kubectl -n yatai-logging get pod -l app.kubernetes.io/name=minio-operator
Expected output:
Note
You need to be patient for a while until the status of all pods becomes Running
NAME                                     READY   STATUS    RESTARTS   AGE
minio-operator-console-9d9cbbcc8-flzrw   1/1     Running   0          2m39s
minio-operator-6c984995c9-l8j2j          1/1     Running   0          2m39s
2. Verify the MinIO tenant installation
Monitor the MinIO tenant components until all of the components show a STATUS of Running or Completed. You can do this by running the following command and inspecting the output:
kubectl -n yatai-logging get pod -l app=minio
Expected output:
Note
Since the pods are created by the minio-operator, it may take a minute for these pods to be created. You need to be patient for a while until the status of all pods becomes Running
NAME                         READY   STATUS    RESTARTS   AGE
yatai-logging-minio-ss-0-0   1/1     Running   0          143m
yatai-logging-minio-ss-0-1   1/1     Running   0          143m
yatai-logging-minio-ss-0-2   1/1     Running   0          143m
yatai-logging-minio-ss-0-3   1/1     Running   0          143m
3. Prepare S3 connection params
export S3_ENDPOINT=minio.yatai-logging.svc.cluster.local
export S3_REGION=foo
export S3_BUCKET_NAME=loki-data
export S3_SECURE=false
export S3_ACCESS_KEY=$(kubectl -n yatai-logging get secret yatai-logging-minio -o jsonpath='{.data.accesskey}' | base64 -d)
export S3_SECRET_KEY=$(kubectl -n yatai-logging get secret yatai-logging-minio -o jsonpath='{.data.secretkey}' | base64 -d)
4. Test S3 connection
kubectl -n yatai-logging delete pod s3-client 2> /dev/null || true; \
kubectl run s3-client --rm --tty -i --restart='Never' \
    --namespace yatai-logging \
    --env "AWS_ACCESS_KEY_ID=$S3_ACCESS_KEY" \
    --env "AWS_SECRET_ACCESS_KEY=$S3_SECRET_KEY" \
    --image quay.io/bentoml/s3-client:0.0.1 \
    --command -- sh -c "s3-client -e http://$S3_ENDPOINT listbuckets && echo successfully"
The output should be:
Note
If the previous command reports an error that the service has not been initialized, please retry several times
successfully
pod "s3-client" deleted
3. Install Loki
1. Install Microservices mode Loki
helm repo add grafana https://grafana.github.io/helm-charts
helm repo update grafana

cat <<EOF | helm upgrade --install loki grafana/loki-distributed -n yatai-logging --version 0.65.0 -f -
loki:
  image:
    registry: quay.io/bentoml
    repository: grafana-loki
    tag: 2.6.1
  structuredConfig:
    ingester:
      # Disable chunk transfer which is not possible with statefulsets
      # and unnecessary for boltdb-shipper
      max_transfer_retries: 0
      chunk_idle_period: 1h
      chunk_target_size: 1536000
      max_chunk_age: 1h
    storage_config:
      aws:
        s3: http://$S3_ACCESS_KEY:$S3_SECRET_KEY@$S3_ENDPOINT/$S3_BUCKET_NAME
        s3forcepathstyle: true
      boltdb_shipper:
        shared_store: s3
    schema_config:
      configs:
        - from: 2020-09-07
          store: boltdb-shipper
          object_store: s3
          schema: v11
          index:
            prefix: loki_index_
            period: 24h
gateway:
  image:
    registry: quay.io/bentoml
    repository: nginxinc-nginx-unprivileged
    tag: 1.19-alpine
EOF
2. Verify the Loki installation
kubectl -n yatai-logging get pod -l app.kubernetes.io/name=loki-distributed
Expected output:
NAME                                                    READY   STATUS    RESTARTS   AGE
loki-loki-distributed-gateway-548dd9b7f7-sw246          1/1     Running   0          2m46s
loki-loki-distributed-query-frontend-6988cd4b8b-72qrh   1/1     Running   0          2m46s
loki-loki-distributed-distributor-5778bc756b-ldbc2      1/1     Running   0          2m46s
loki-loki-distributed-querier-0                         1/1     Running   0          2m46s
loki-loki-distributed-ingester-0                        1/1     Running   0          2m46s
4. Install Promtail
1. Install Promtail helm chart
cat <<EOF | helm upgrade --install promtail grafana/promtail -n yatai-logging --version 6.6.1 -f -
config:
  clients:
    - url: http://loki-loki-distributed-gateway.yatai-logging.svc.cluster.local/loki/api/v1/push
      tenant_id: 1
  snippets:
    pipelineStages:
      - docker: {}
      - cri: {}
      - multiline:
          firstline: '^[^ ]'
          max_wait_time: 500ms
    extraRelabelConfigs:
      - action: replace
        source_labels:
          - __meta_kubernetes_pod_label_yatai_ai_bento_deployment
        target_label: yatai_bento_deployment
      - action: replace
        source_labels:
          - __meta_kubernetes_pod_label_yatai_ai_bento_deployment_component_type
        target_label: yatai_bento_deployment_component_type
      - action: replace
        source_labels:
          - __meta_kubernetes_pod_label_yatai_ai_bento_deployment_component_name
        target_label: yatai_bento_deployment_component_name
EOF
2. Verify the Promtail installation
kubectl -n yatai-logging get pod -l app.kubernetes.io/name=promtail
Expected output:
NAME             READY   STATUS    RESTARTS        AGE
promtail-kqnnm   1/1     Running   0               13m
promtail-t76fm   1/1     Running   0               13m
promtail-rrflp   1/1     Running   0               13m
5. Set Loki as the Grafana datasource
Note
The following steps are assuming you have already have Grafana installed in your cluster and sidecar.datasources.enabled turned on.
1. Create the Grafana datasource configmap
cat <<EOF > /tmp/loki-datasource.yaml
apiVersion: 1
datasources:
- name: Loki
  type: loki
  access: proxy
  url: http://loki-loki-distributed-gateway.yatai-logging.svc.cluster.local
  version: 1
  editable: false
EOF

kubectl -n yatai-monitoring create configmap loki-datasource --from-file=/tmp/loki-datasource.yaml
kubectl -n yatai-monitoring label configmap loki-datasource grafana_datasource=1
2. Restart the Grafana pod
kubectl -n yatai-monitoring rollout restart deployment grafana
Make sure the Grafana pod is restarted successfully:
kubectl -n yatai-monitoring get pod -l app.kubernetes.io/name=grafana
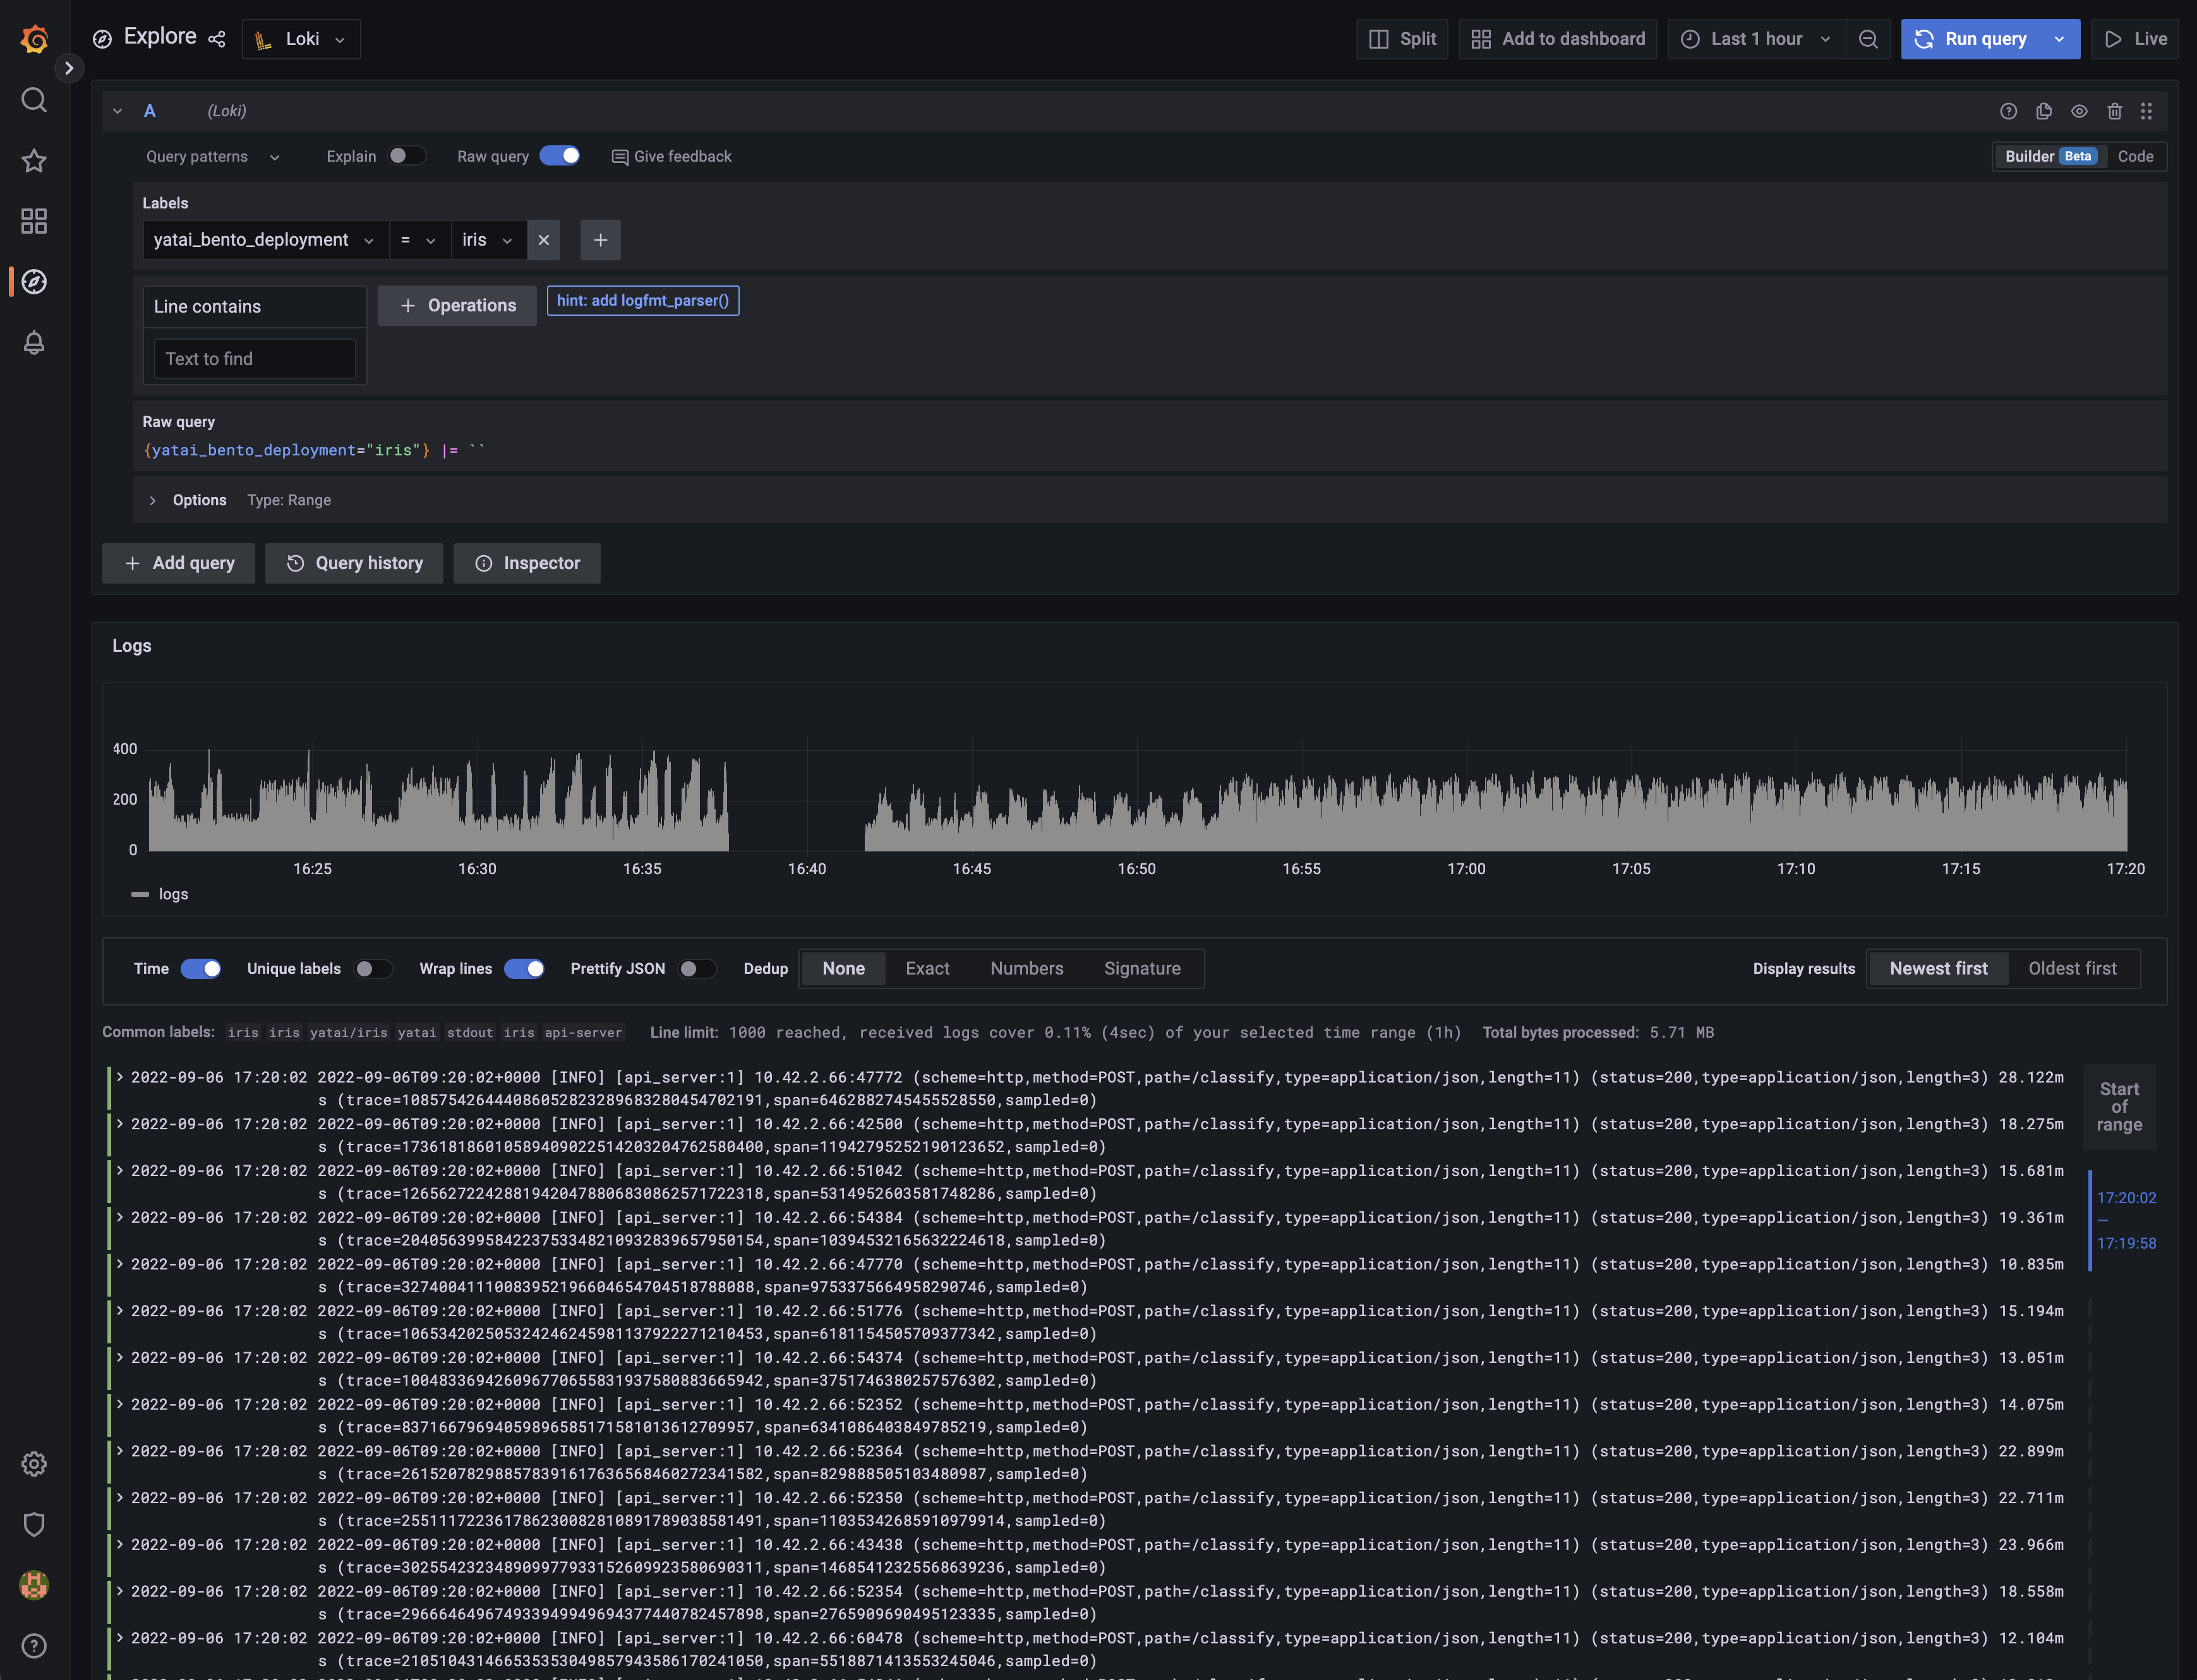
6. View the logs in Grafana