Collecting Metrics
Yatai supports the use of Prometheus to collect metrics for BentoDeployment
Note
This documentation is just for BentoDeployment metrics, not for Yatai itself.
Prerequisites
yatai-deployment
Because the metrics collected are related to BentotDeployment, it relies on yatai-deployment
Kubernetes
Kubernetes cluster with version 1.20 or newer
Note
If you do not have a production Kubernetes cluster and want to install yatai for development and testing purposes. You can use minikube to set up a local Kubernetes cluster for testing.
Dynamic Volume Provisioning
As Prometheus requires metrics storage, you need to enable dynamic volume provisioning in your Kubernetes cluster. For more detailed information, please refer to Dynamic Volume Provisioning.
Helm
We use Helm to install Prometheus Stack.
Quick setup
Note
This quick setup script can only be used for development and testing purposes
This script will automatically install the following dependencies inside the yatai-monitoring namespace of the Kubernetes cluster:
Prometheus Operator
Prometheus
Grafana
Alertmanager
bash <(curl -s "https://raw.githubusercontent.com/bentoml/yatai/main/scripts/quick-setup-yatai-monitoring.sh")
Setup steps
1. Install Prometheus Stack
1. Create a namespace for Prometheus Stack
kubectl create ns yatai-monitoring
2. Install prometheus-operator
helm repo add prometheus-community https://prometheus-community.github.io/helm-charts
helm repo update prometheus-community

cat <<EOF | helm install prometheus prometheus-community/kube-prometheus-stack -n yatai-monitoring -f -
grafana:
  enabled: false
  forceDeployDatasources: true
  forceDeployDashboards: true
EOF
3. Verify that Prometheus is running
kubectl -n yatai-monitoring get pod -l release=prometheus
The output of the command above should look something like this:
NAME                                                   READY   STATUS    RESTARTS   AGE
prometheus-kube-prometheus-operator-6f5c99cd68-6kshn   1/1     Running   0          21h
prometheus-kube-state-metrics-668449846c-tm2nb         1/1     Running   0          21h
prometheus-prometheus-node-exporter-ljlxk              1/1     Running   0          20h
prometheus-prometheus-node-exporter-fnxs2              1/1     Running   0          20h
prometheus-prometheus-node-exporter-gqq8c              1/1     Running   0          20h
4. Verify that the CRDs of prometheus-operator has been established
kubectl wait --for condition=established --timeout=120s crd/prometheuses.monitoring.coreos.com
kubectl wait --for condition=established --timeout=120s crd/servicemonitors.monitoring.coreos.com
The output of the command above should look something like this:
customresourcedefinition.apiextensions.k8s.io/prometheuses.monitoring.coreos.com condition met
customresourcedefinition.apiextensions.k8s.io/servicemonitors.monitoring.coreos.com condition met
5. Verify that the Prometheus service is running
kubectl -n yatai-monitoring get pod -l app.kubernetes.io/instance=prometheus-kube-prometheus-prometheus
The output of the command above should look something like this:
NAME                                                 READY   STATUS    RESTARTS   AGE
prometheus-prometheus-kube-prometheus-prometheus-0   2/2     Running   0          15m
6. Verify that the Alertmanager service is running
kubectl -n yatai-monitoring get pod -l app.kubernetes.io/instance=prometheus-kube-prometheus-alertmanager
The output of the command above should look something like this:
NAME                                                     READY   STATUS    RESTARTS   AGE
alertmanager-prometheus-kube-prometheus-alertmanager-0   2/2     Running   0          18m
7. Install Grafana
helm repo add grafana https://grafana.github.io/helm-charts
helm repo update grafana

cat <<EOF | helm install grafana grafana/grafana -n yatai-monitoring -f -
adminUser: admin
adminPassword: $(LC_ALL=C tr -dc 'A-Za-z0-9' < /dev/urandom | head -c 20)
persistence:
  enabled: true
sidecar:
  dashboards:
    enabled: true
  datasources:
    enabled: true
  notifiers:
    enabled: true
EOF
8. Verify that the Grafana service is running
kubectl -n yatai-monitoring get pod -l app.kubernetes.io/name=grafana
The output of the command above should look something like this:
NAME                       READY   STATUS    RESTARTS   AGE
grafana-796c6947b7-r7gr4   3/3     Running   0          3m40s
9. Visit the Prometheus web UI
You can create an ingress for prometheus-kube-prometheus-prometheus service or port-forward the service to :9090:
kubectl -n yatai-monitoring port-forward svc/prometheus-kube-prometheus-prometheus 9090:9090 --address 0.0.0.0
Then visit the Prometheus web UI via http://localhost:9090
10. Visit the Grafana web UI
You can create an ingress for prometheus-grafana service or port-forward the service to :8888:
kubectl -n yatai-monitoring port-forward svc/grafana 8888:80 --address 0.0.0.0
Then visit the Grafana web UI via http://localhost:8888
Note
Use the following command to get the Grafana username:
kubectl -n yatai-monitoring get secret grafana -o jsonpath='{.data.admin-user}' | base64 -d
Use the following command to get the Grafana password:
kubectl -n yatai-monitoring get secret grafana -o jsonpath='{.data.admin-password}' | base64 -d
2. Collect BentoDeployment metrics
1. Create PodMonitor for BentoDeployment
kubectl apply -f https://raw.githubusercontent.com/bentoml/yatai/main/scripts/monitoring/bentodeployment-podmonitor.yaml
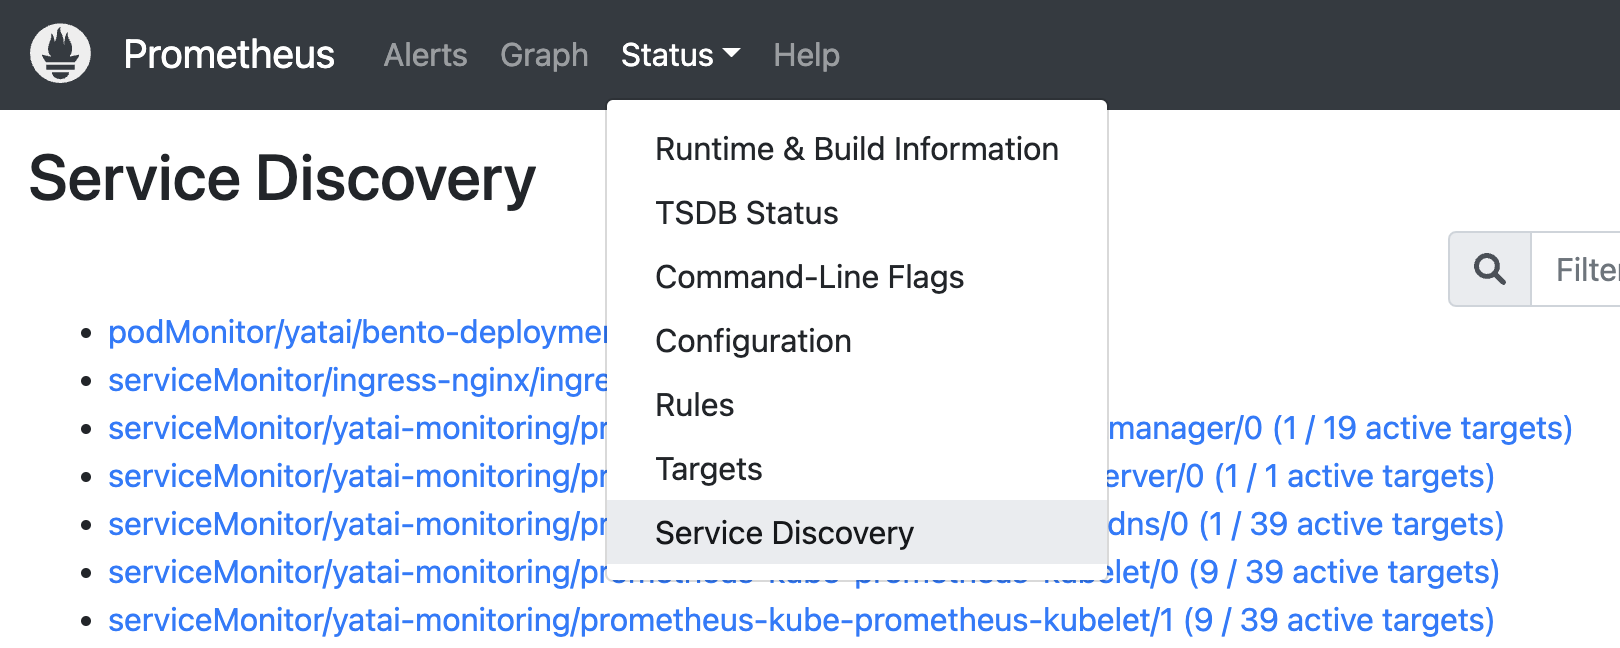
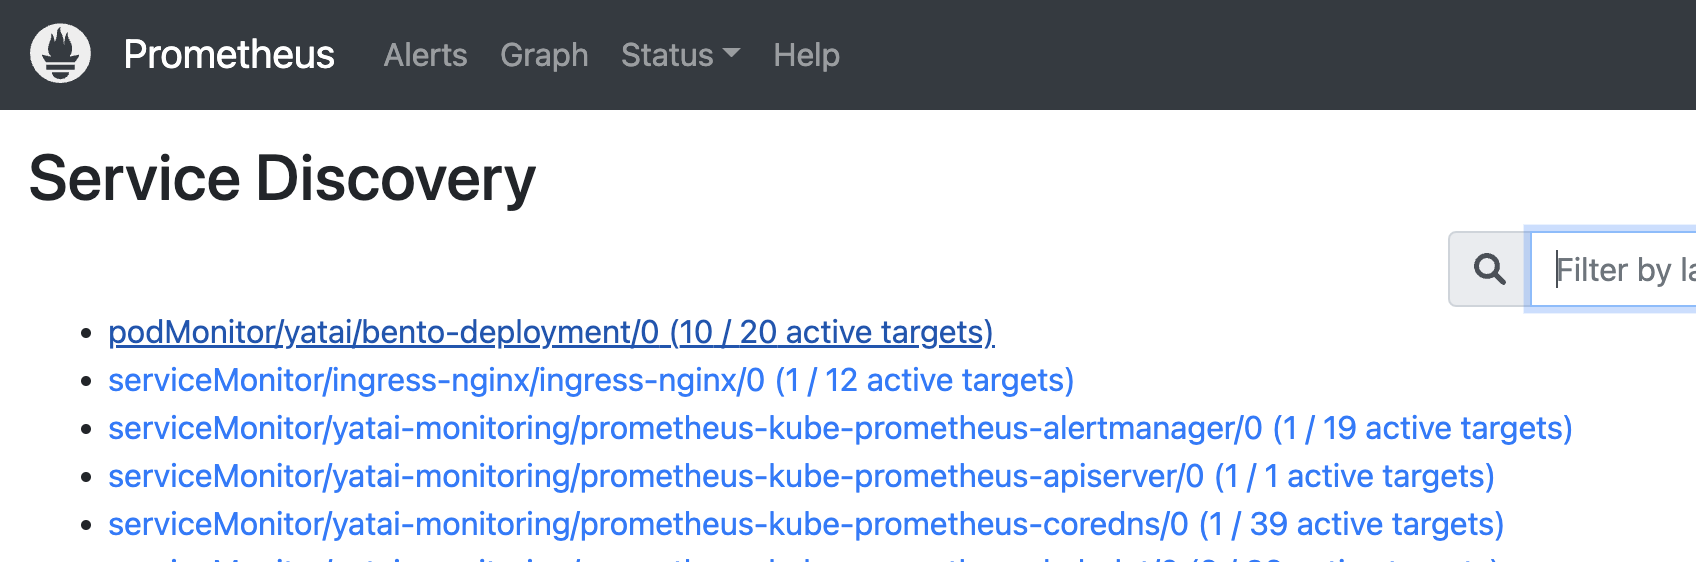
After some time you can see in the service discovery page in the Prometheus web UI that the bento deployment has been discovered:
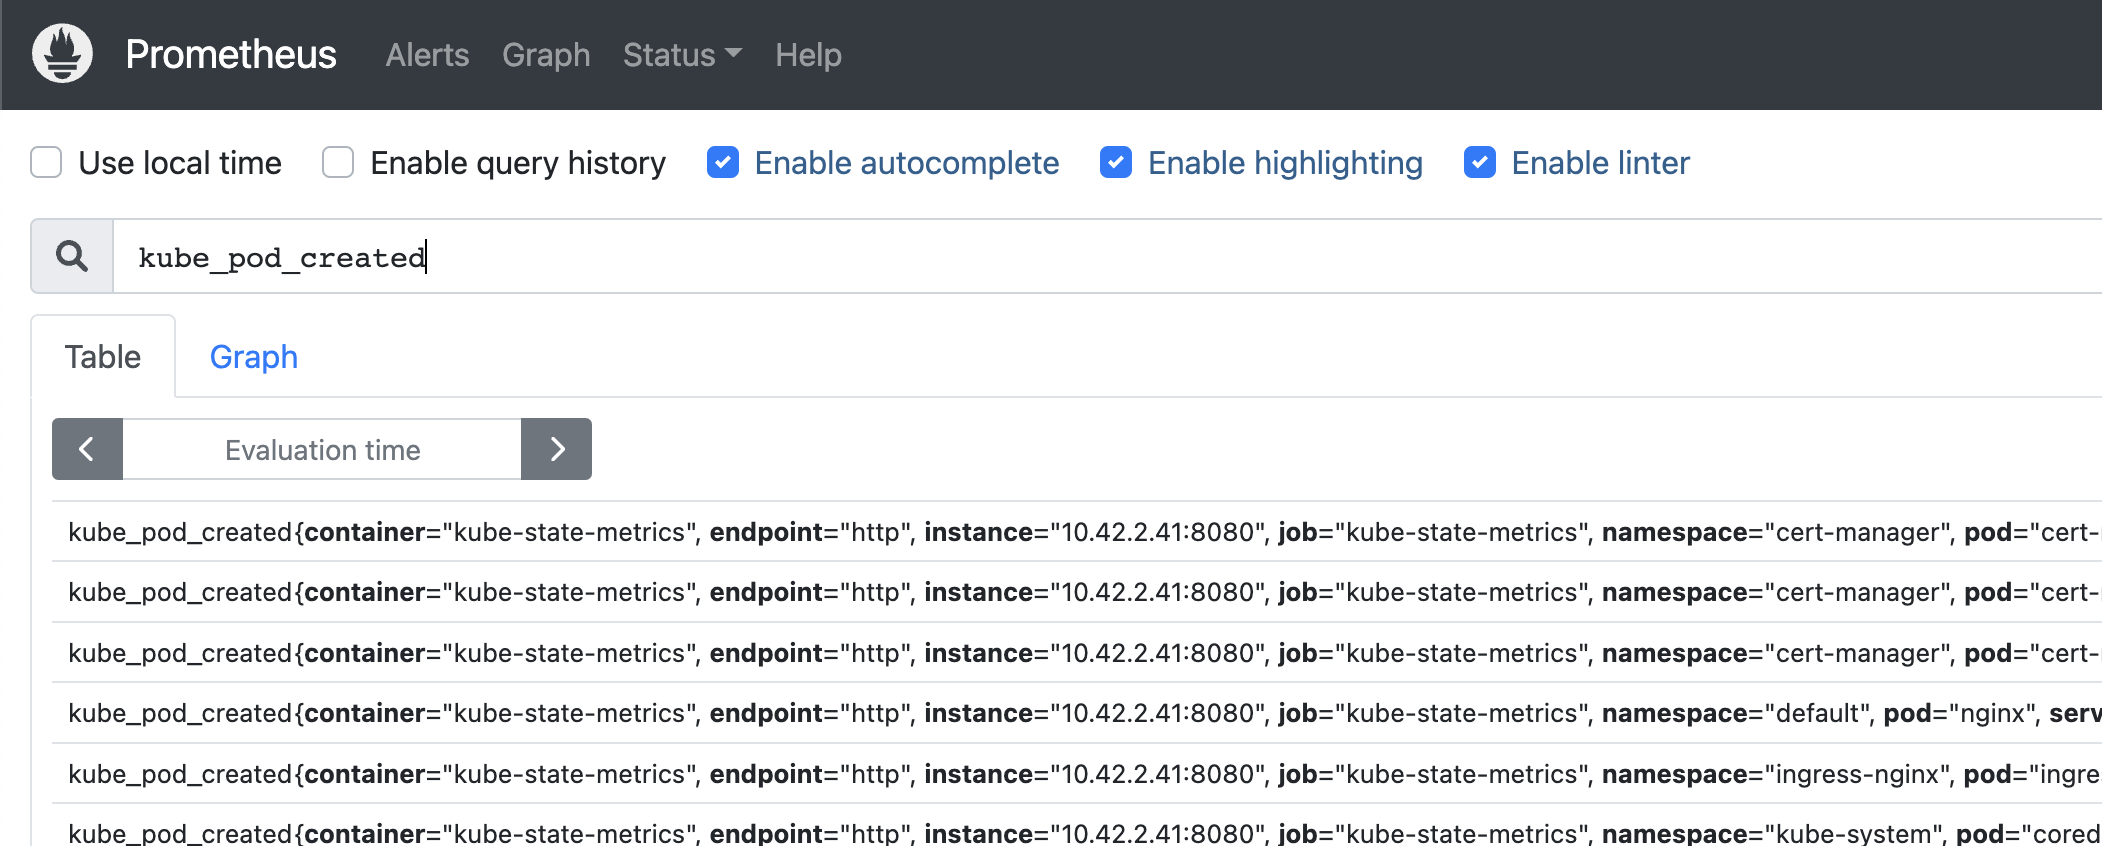
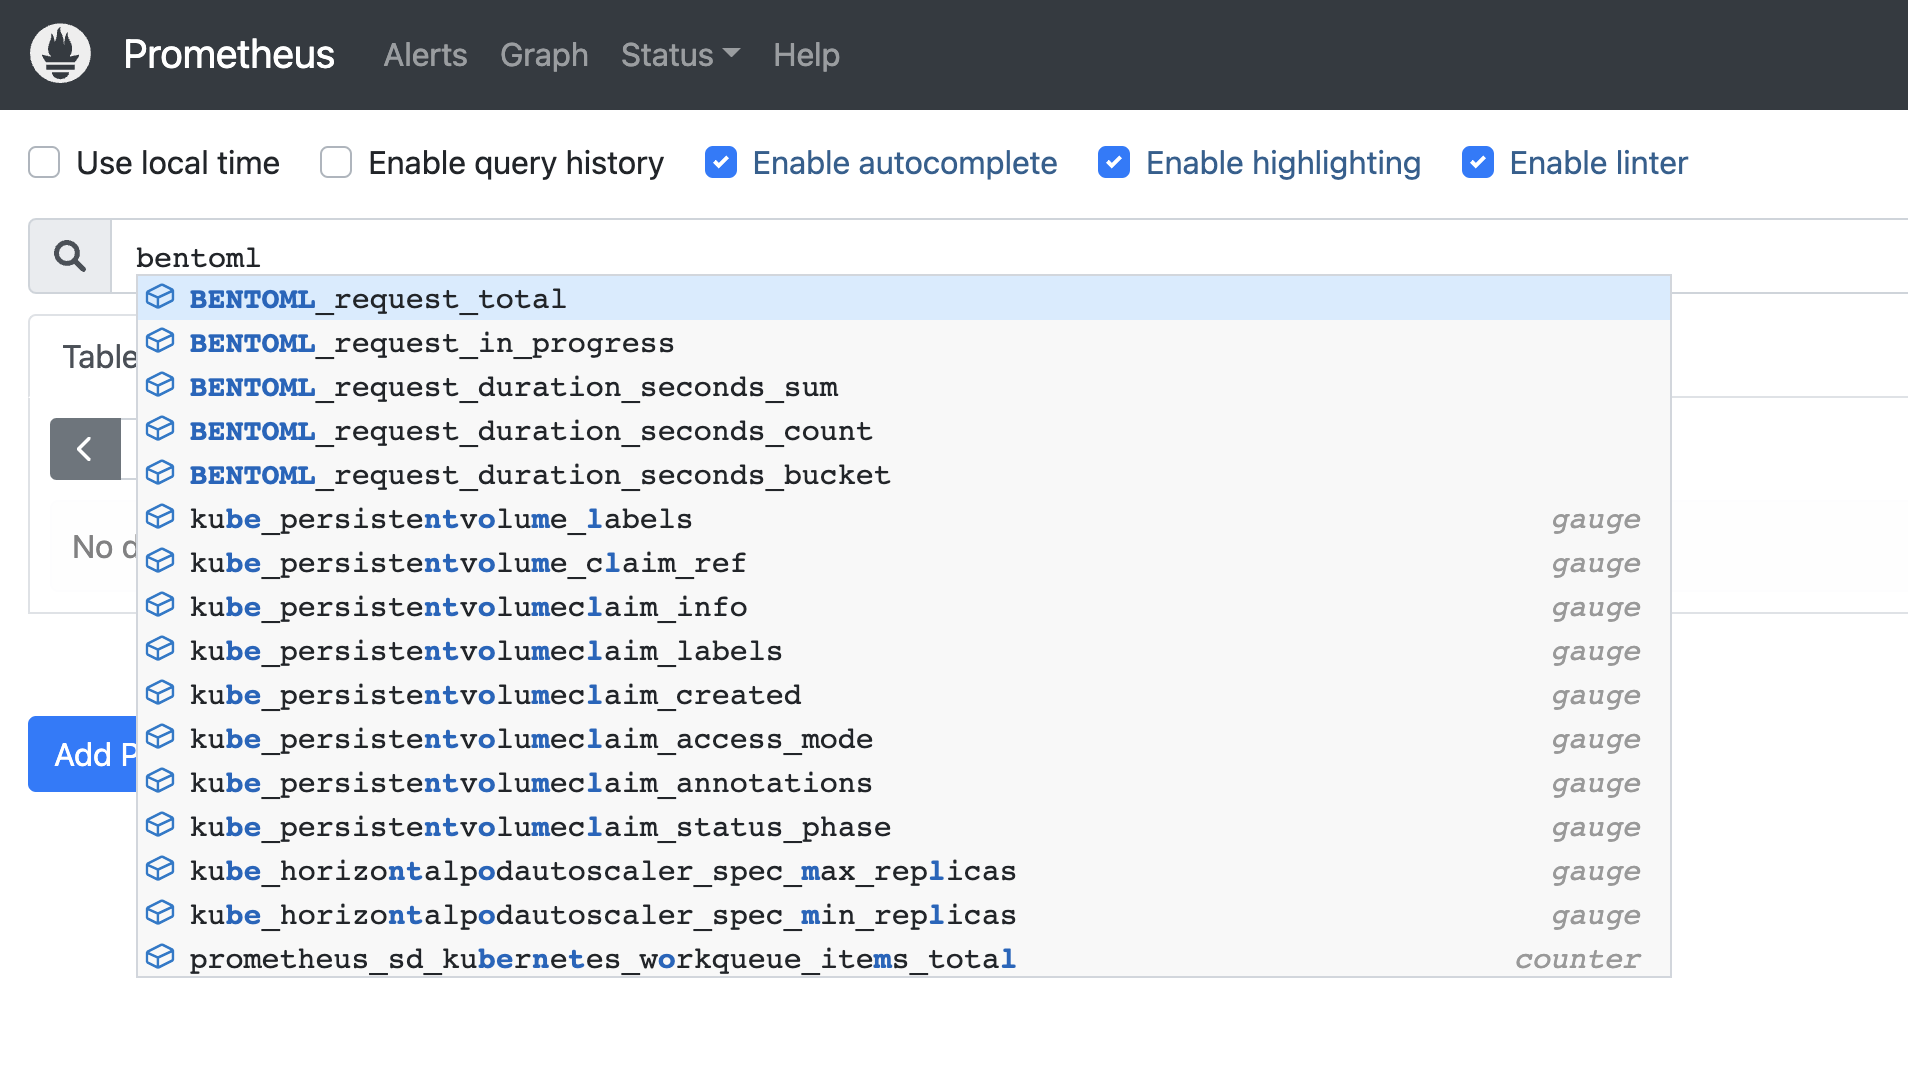
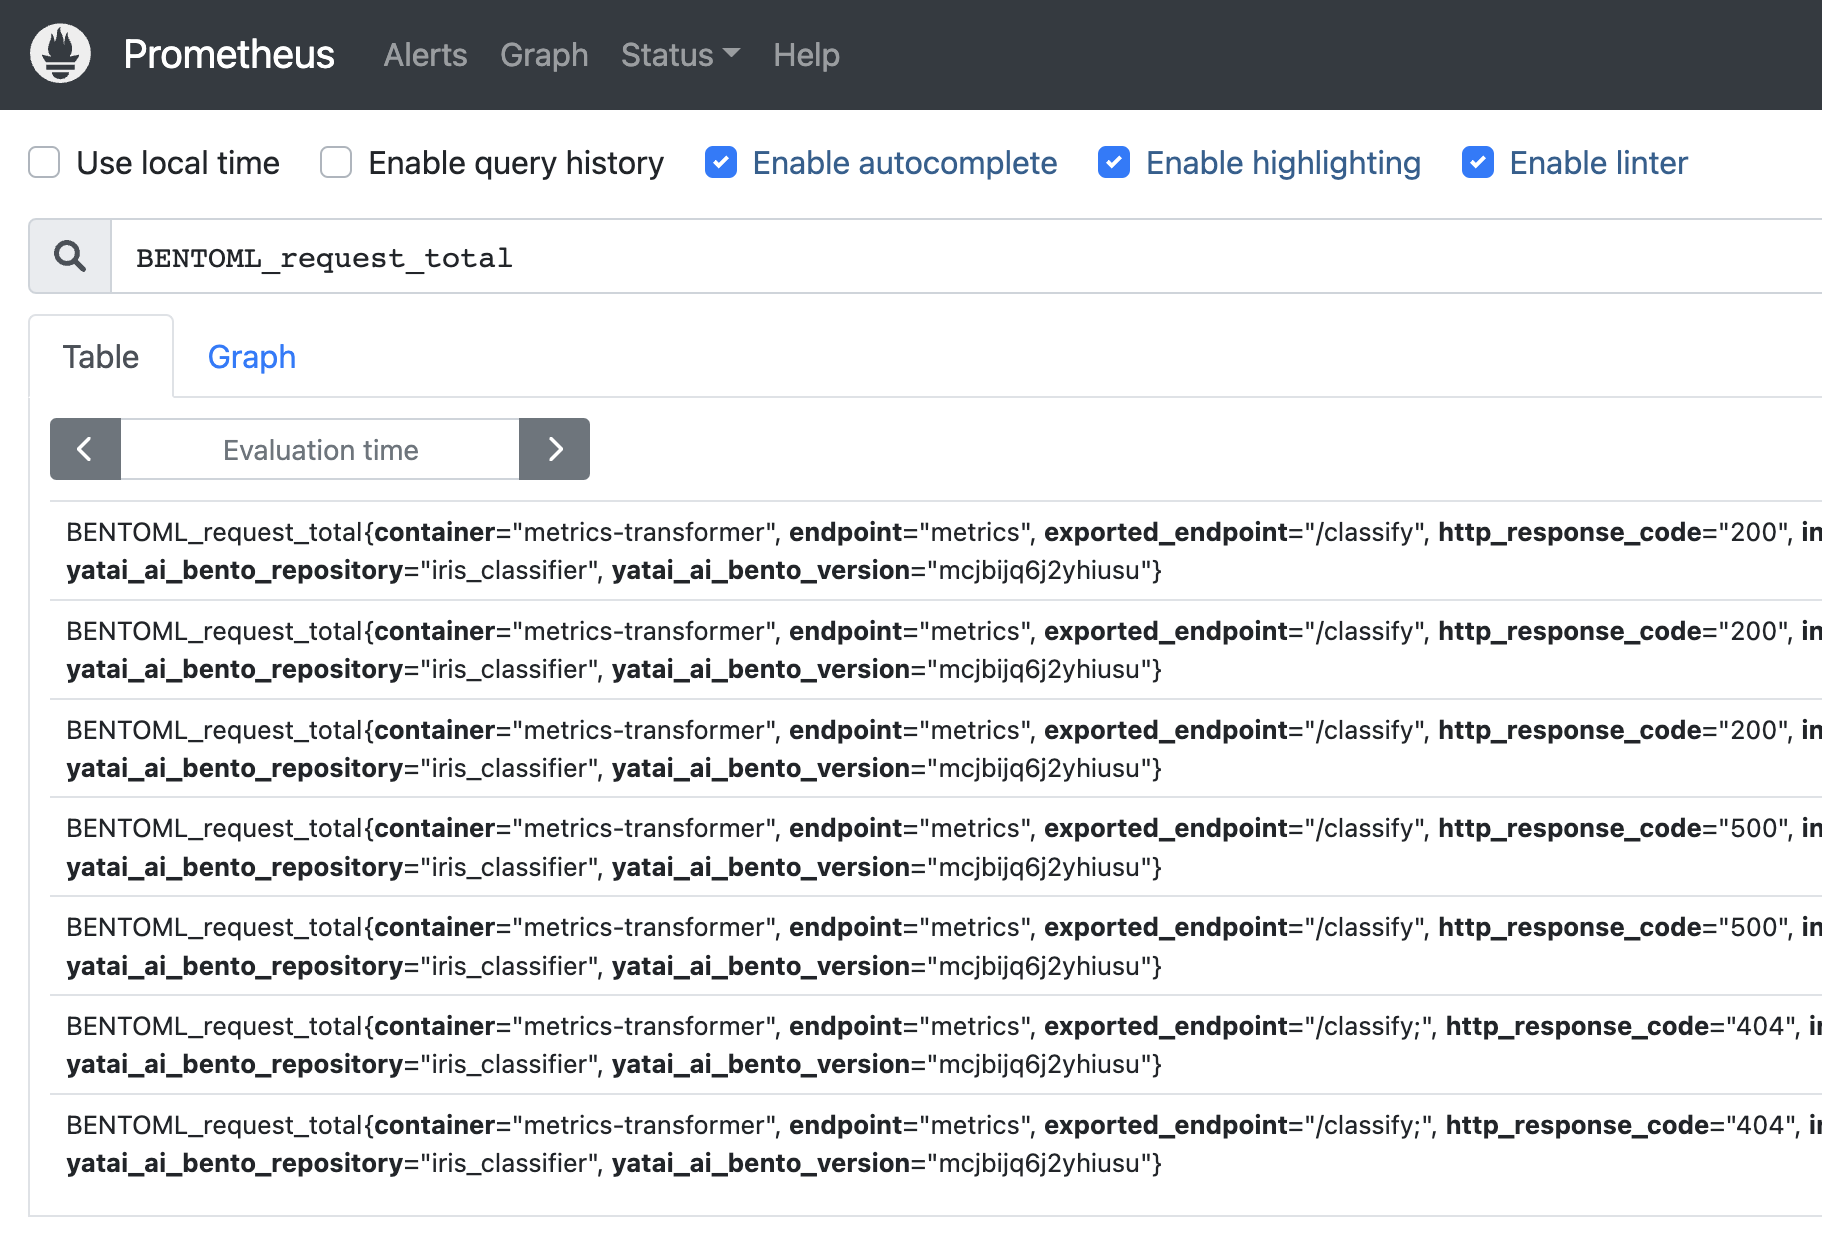
Now you can auto-complete to BentoML’s metrics in the prometheus expression input box:
3. Create Grafana Dashboard for BentoDeployment
1. Download the BentoDeployment Grafana dashboard json file
curl -L https://raw.githubusercontent.com/bentoml/yatai/main/scripts/monitoring/bentodeployment-dashboard.json -o /tmp/bentodeployment-dashboard.json
curl -L https://raw.githubusercontent.com/bentoml/yatai/main/scripts/monitoring/bentofunction-dashboard.json -o /tmp/bentofunction-dashboard.json
2. Create Grafana dashboard configmap
kubectl -n yatai-monitoring create configmap bentodeployment-dashboard --from-file=/tmp/bentodeployment-dashboard.json
kubectl -n yatai-monitoring label configmap bentodeployment-dashboard grafana_dashboard=1

kubectl -n yatai-monitoring create configmap bentofunction-dashboard --from-file=/tmp/bentofunction-dashboard.json
kubectl -n yatai-monitoring label configmap bentofunction-dashboard grafana_dashboard=1
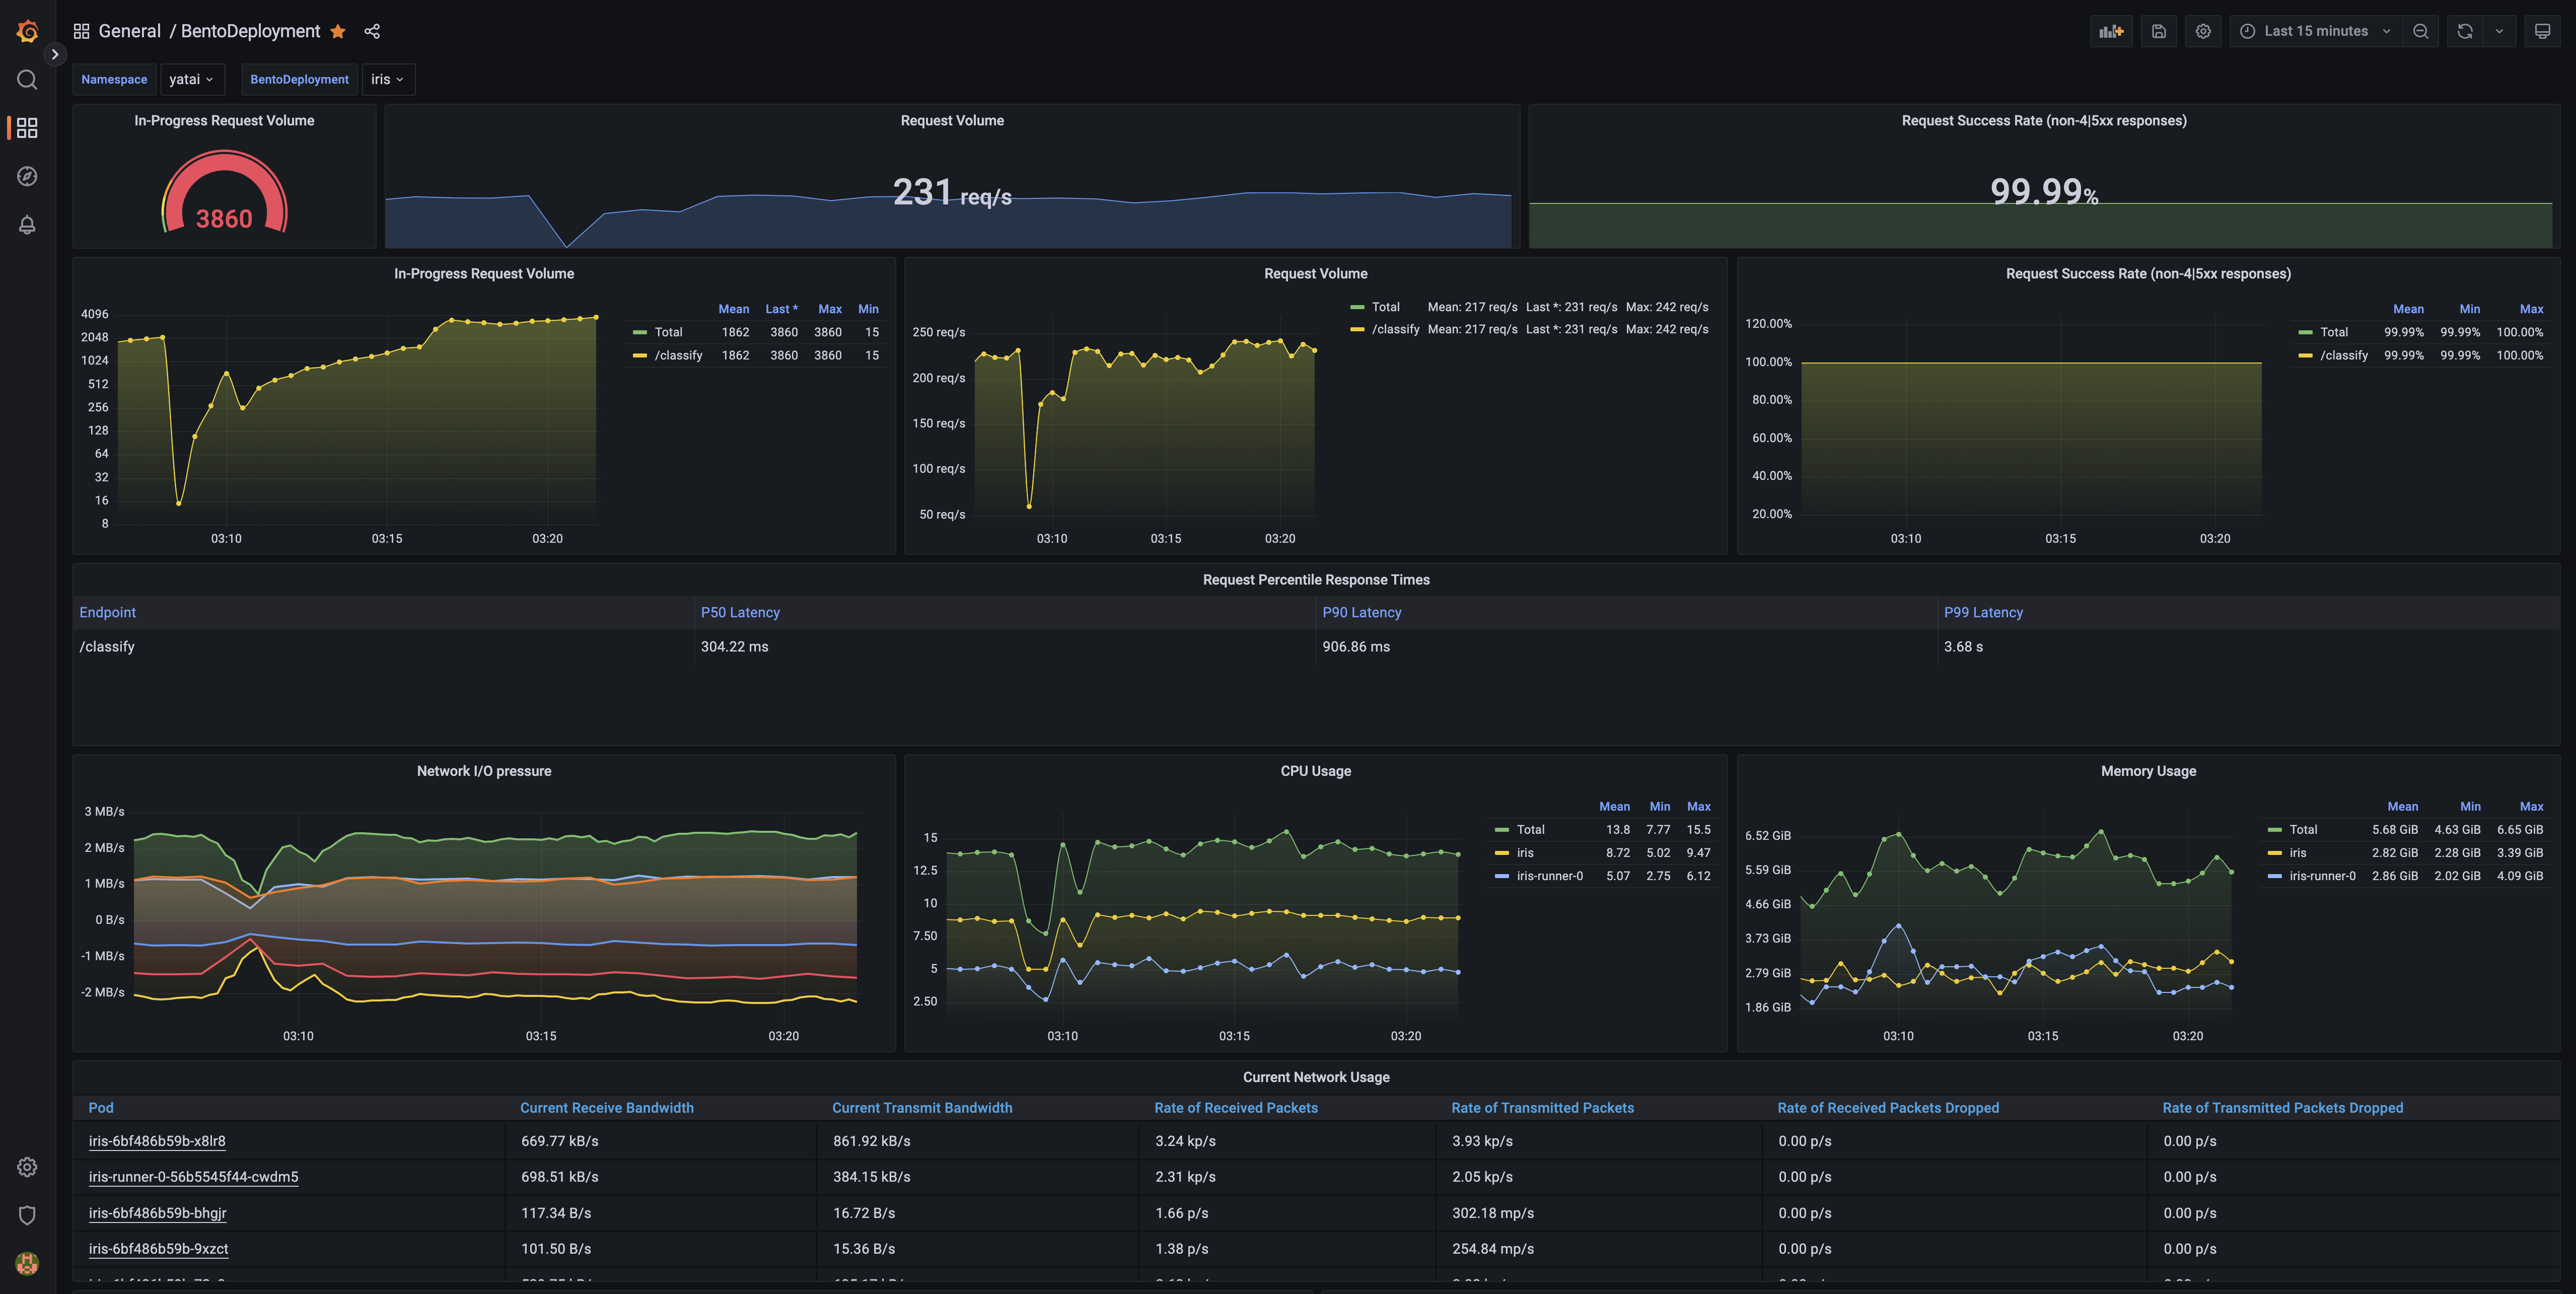
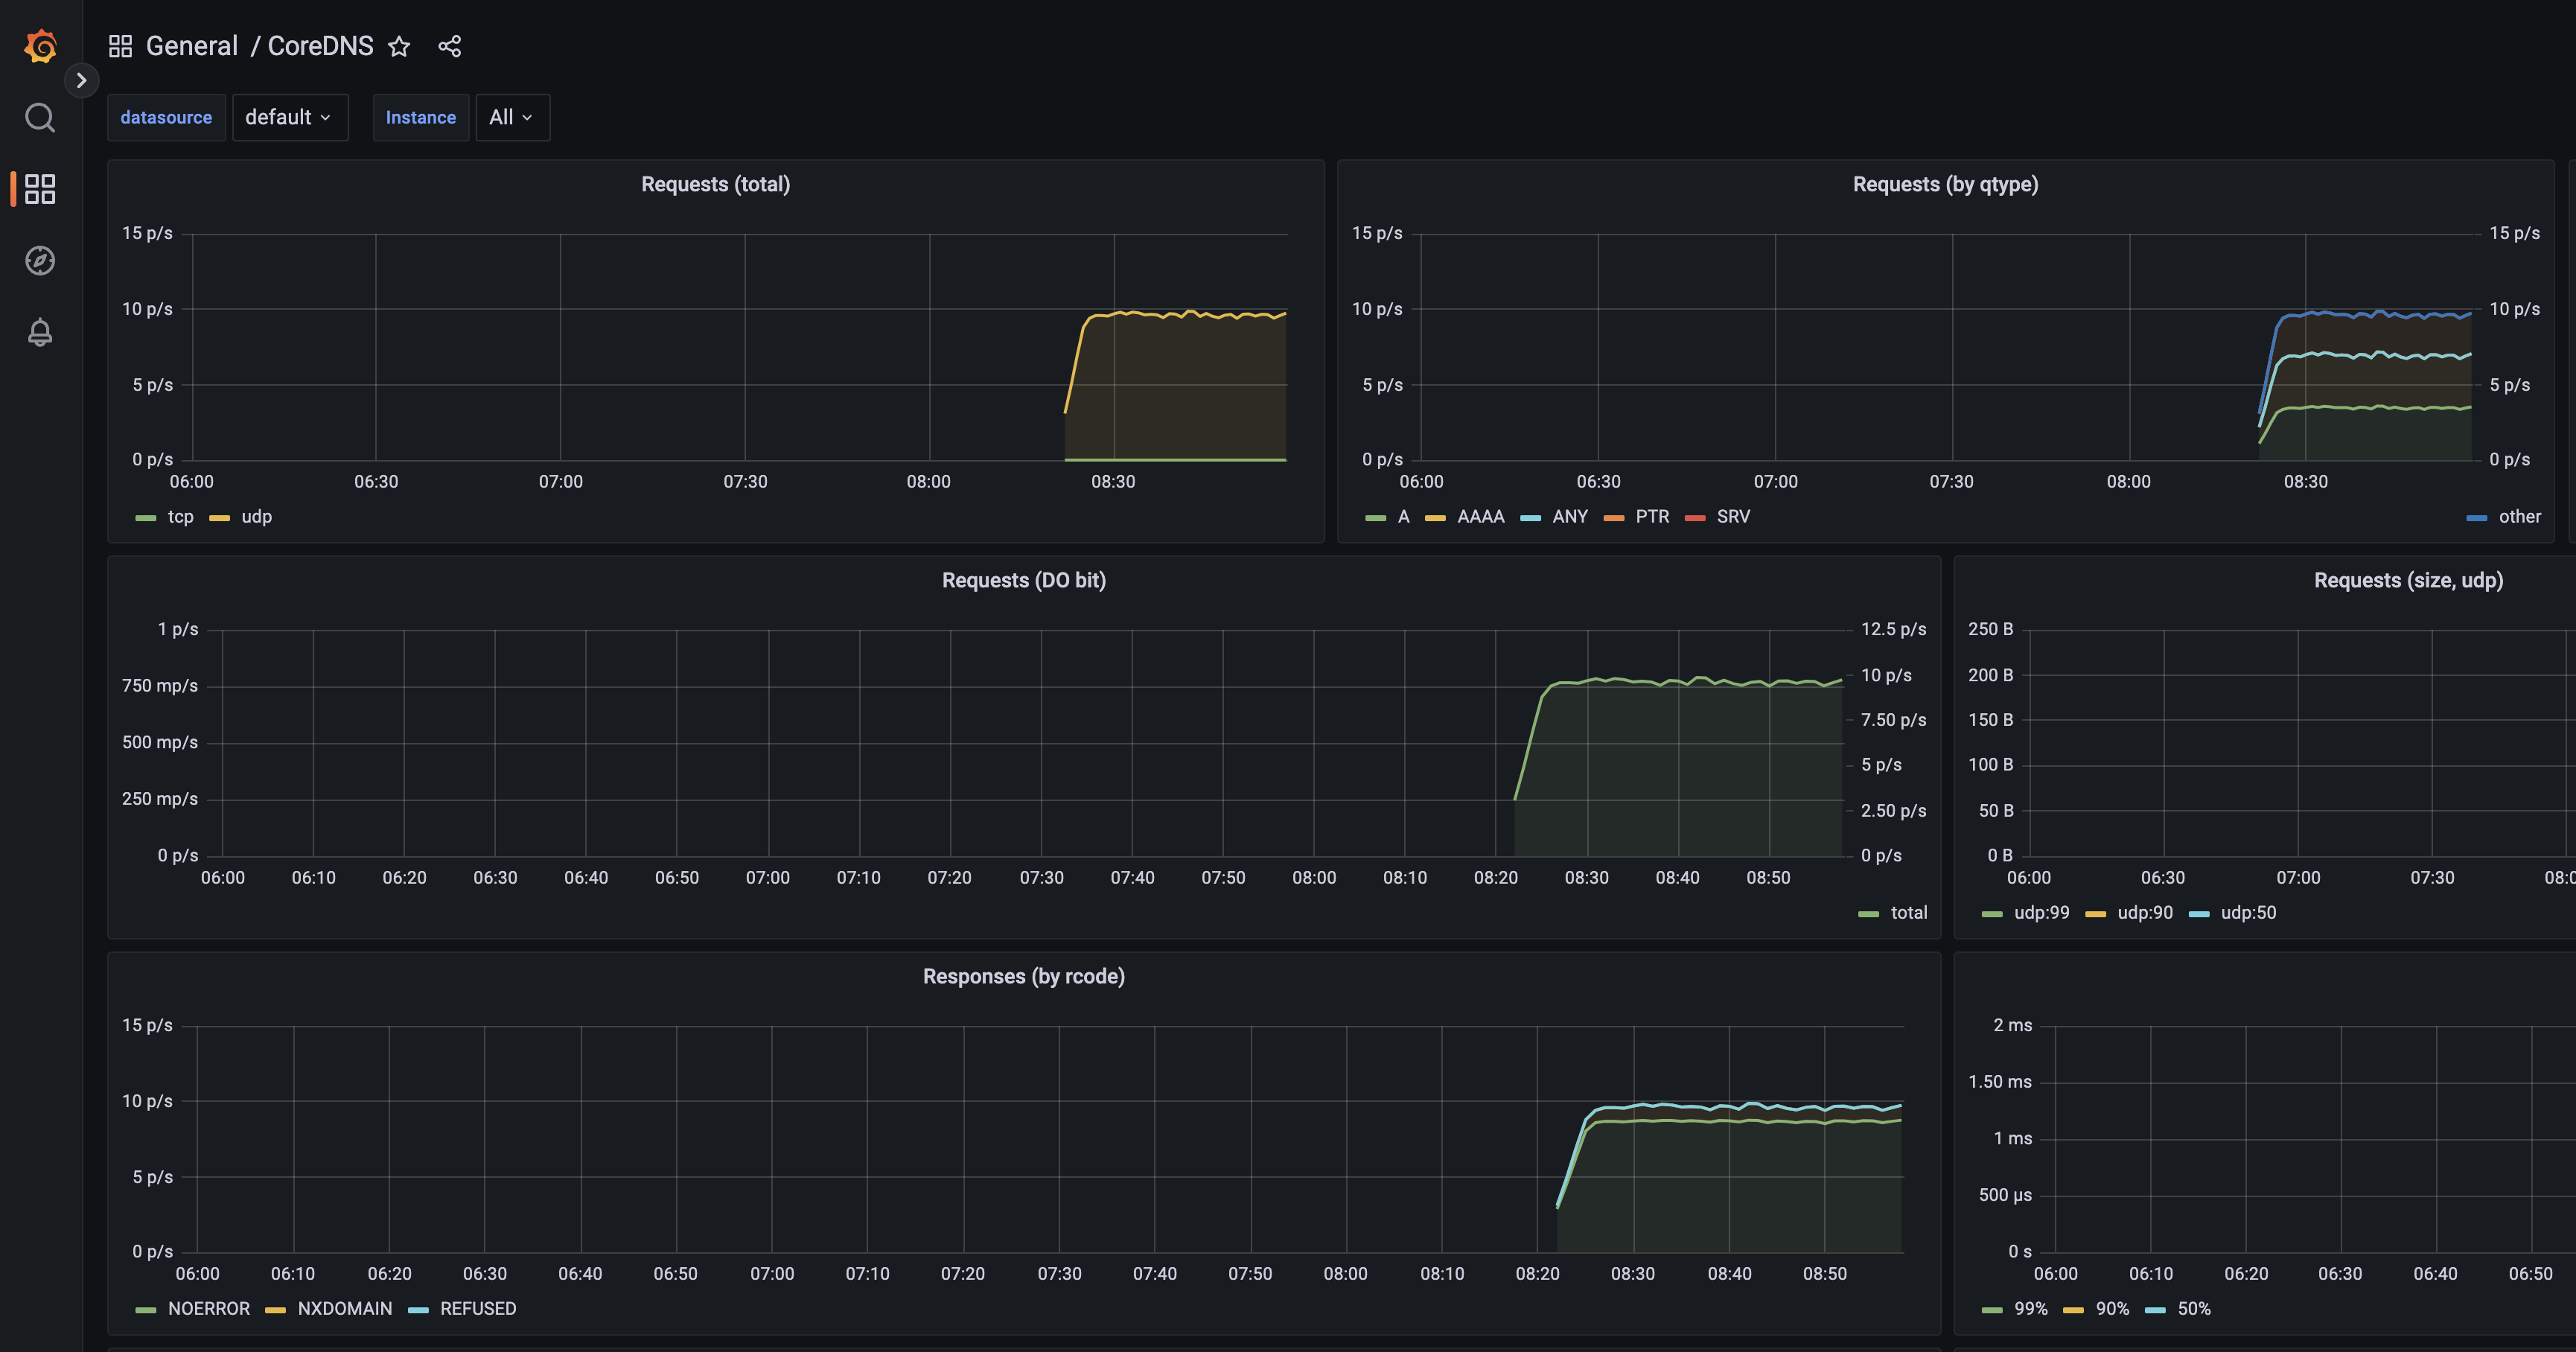
3. Go to the Grafana web UI to check out the BentoDeployment dashboard
Note
Wait a few minutes for the Grafana process to automatically reload the configuration